
Statistical analysis: Year 8 – planning tool
This planning resource for Year 8 is for the topic of Statistical analysis. Students focus on understanding that random samples chosen from large populations can show quite different distributions and proportions when compared with each other. Students make connections when different sample sizes are or can be responsible for this effect, which can be shown numerically or visually.
- Resource details
- Year level
- Year 8
- Purpose
- Planning Teaching resource Teaching strategies Student activities
- Strand
- Statistics
- Topic
- Data representation and interpretation
- Audience
- Teachers
- Format
- Webpage
- Australian Curriculum code
- AC9M8ST03
- Numeracy progression
- Interpreting and representing data (P7)
- Publisher
- Commonwealth of Australia
- Copyright
- © 2023 Commonwealth of Australia, unless otherwise indicated. Creative Commons Attribution 4.0, unless otherwise indicated
- Other terms
- lesson plans assessment task teaching strategies pedagogies Australian Curriculum learning from home misconceptions
Related resources
-
Data representations (Year 8)
Types of data and variation across data sets.
Resource details -
Increasing sample size
This video resource compares the reliability of a smaller sample size compared to a larger sample size of a population.
Resource details -
Collect, sort and compare data: Year 8 – planning tool
This planning resource for Year 8 is for the topic of Collect, sort and compare data.
Resource details -
Interpret and discuss data displays: Year 8 – planning tool
This planning resource for Year 8 is for the topic of Interpret and discuss data displays.
Resource details -
Statistics and probability
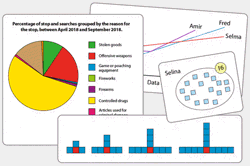
These units explore the relationship between probability and the way data is represented.
Resource details -
Educational Datasets
These teacher guides describe the datasets for teachers and provide a range of lesson activities for students in Years 3 to 10. Datasets are grouped according to where the data's context fits into learning areas of the Australian Curriculum.
Resource details -
Awareness of outliers
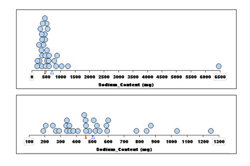
Students graph data about sodium content in foods and compare the statistics with and without the outlier value.
Resource details