
Please note: This site contains links to websites not controlled by the Australian Government or ESA. Read more in the Terms of Use.
Increasing sample size
This video resource can be used to identify the value of having a larger sample to use to show a reliable comparison to the population. It could be used as a starting prompt. It includes some questions to ask students to encourage mathematical thinking.
- Resource details
- Year level
- Year 8
- Purpose
- Teaching resource
- Strand
- Statistics
- Topic
- Data representation and interpretation
- Audience
- Teachers
- Format
- Video
- Australian Curriculum code
- AC9M8ST01
- Numeracy progression
- Interpreting and representing data (P7)
- Publisher
- AAMT
- Copyright
- © 2013 Education Services Australia. Free-for-education material.
- Keywords
- data displays data distributions
Related resources
-
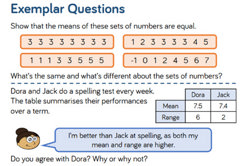
Statistical analysis: Year 8 – planning tool
This planning resource for Year 8 is for the topic of Statistical analysis.
Resource details -
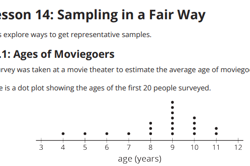
Collect, sort and compare data: Year 8 – planning tool
This planning resource for Year 8 is for the topic of Collect, sort and compare data.
Resource details -
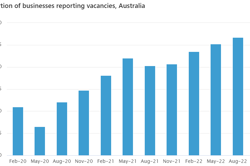
Interpret and discuss data displays: Year 8 – planning tool
This planning resource for Year 8 is for the topic of Interpret and discuss data displays.
Resource details -
Educational Datasets
These teacher guides describe the datasets for teachers and provide a range of lesson activities for students in Years 3 to 10. Datasets are grouped according to where the data's context fits into learning areas of the Australian Curriculum.
Resource details -
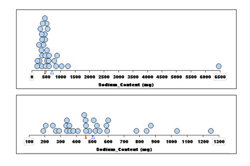
Awareness of outliers
Students graph data about sodium content in foods and compare the statistics with and without the outlier value.
Resource details -
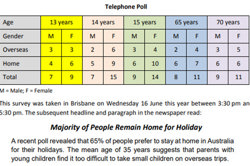
Exploring bias
Students explore the effect of bias and outliers on summary statistics.
Resource details -

The humanoid project
Students explore a large data set.
Resource details