Please note: This site contains links to websites not controlled by the Australian Government or ESA. More information here.
reSolve: What's In A Name?
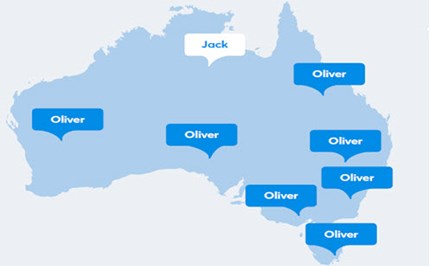
This sequence of two lessons examines trends in the names of students in the class, as well as trends in popular names from 2017 and 1957. Students explore data associated with these names and decide whether the mean, median or mode might be a suitable measure of central tendency. They develop their skills with spreadsheets by carrying out statistical calculations. Each lesson is outlined in detail including curriculum links, vocabulary, materials needed, discussion points, internet resources and spreadsheets of historical name data. This sequence is part of the reSolve: Mathematics by Inquiry program.
Additional details |
|
| Year level(s) | Year 7 |
|---|---|
| Audience | Teacher |
| Purpose | Teaching resource |
| Format | Downloadable resources |
| Teaching strategies and pedagogical approaches | Mathematics investigation |
| Keywords | data representation, range, personal names, central tendency |
Curriculum alignment |
|
| Curriculum connections | Numeracy |
| Strand and focus | Statistics, Build understanding, Apply understanding |
| Topics | Data representation and interpretation |
| AC: Mathematics (V9.0) content descriptions |
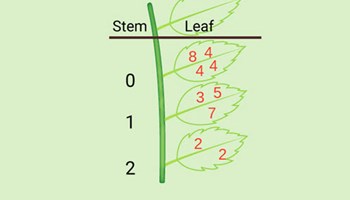
AC9M7ST02
Create different types of numerical data displays including stem-and-leaf plots using software where appropriate; describe and compare the distribution of data, commenting on the shape, centre and spread including outliers and determining the range, median, mean and mode |
| Numeracy progression |
Interpreting and representing data (P5)
|
Copyright details |
|
| Organisation | reSolve Maths by Inquiry |
| Copyright | © Australian Government Department of Education, Skills and Employment 2021. Creative Commons BY-NC-SA 4.0. |
Related resources
-
Stem and leaf plots
A collection of resources for teaching stem and leaf plots.
Resource details -

Give it your best shot
Using the context of sport, students are introduced to calculating the mean, median and mode of a set of data, and how to interpret their findings. Students go on to explore other contexts.
Resource details -
Acquire and record data: Year 7 – planning tool
This planning resource for Year 7 is for the topic of Acquire and record data.
Resource details -
Represent collected data: Year 7 – planning tool
This planning resource for Year 7 is for the topic of Represent collected data.
Resource details