Please note: This site contains links to websites not controlled by the Australian Government or ESA. More information here.
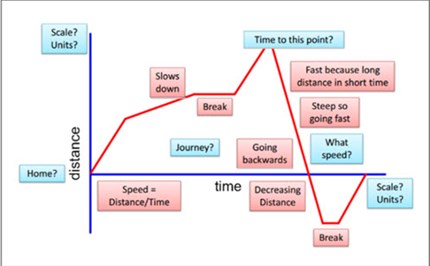
Distance time graph
This sequence of lessons explores how well students understand the relationship between distance and time, through interpreting distance and time graphs. This is achieved by figuring out the displacement and acceleration of an object, determining speed and velocity. The lessons are accompanied by a PowerPoint and a student prompt sheet.
Additional details |
|
| Year level(s) | Year 7 |
|---|---|
| Audience | Teacher |
| Purpose | Assessment task, Student task, Teaching resource, Teaching strategies |
| Format | Downloadable resources |
| Teaching strategies and pedagogical approaches | Collaborative learning, Differentiated teaching, Feedback, Mathematics investigation, Questioning, Worked examples |
| Keywords | distance, time, speed, veloctiy, displacement, acceleration, negative and positive acceleration |
Curriculum alignment |
|
| Curriculum connections | Critical and creative thinking, English, Numeracy |
| Strand and focus | Number, Build understanding, Apply understanding |
| Topics | Addition and subtraction, Data representation and interpretation, Integers, Time, Using units of measurement |
| AC: Mathematics (V9.0) content descriptions |
AC9M7A04
Describe relationships between variables represented in graphs of functions from authentic data |
| Numeracy progression |
Measuring time (P7)
Number patterns and algebraic thinking (P7) Interpreting and representing data (P6) |
Copyright details |
|
| Organisation | Inquiry Maths |
| Copyright | © Andrew Blair 2012-21. Creative Commons BY-NC-SA 4.0. |
Related resources
-
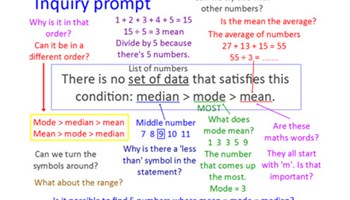
Averages
A lesson sequence that involves students determining the meaning of median, mode, mean and range from a list of data.
Resource details -
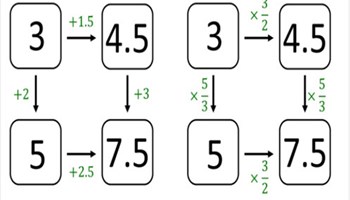
Ratio connections
A short mathematical inquiry that focuses on multiplicative relations to help students understand ratio.
Resource details -
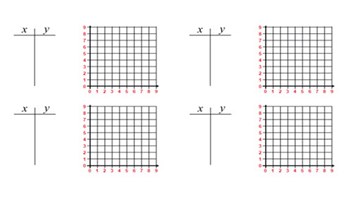
Straight line?
A lesson sequence that involves students understanding the process of plotting linear relationships on the Cartesian plane.
Resource details -
Addition pyramid
Finding the sum of integers.
Resource details