
Conduct statistical investigations: Year 5 – planning tool
This planning resource for Year 5 is for the topic of Conduct statistical investigations. Students plan and conduct a statistical investigation. They pose questions and collect data using simple surveys or checklists. They select appropriate ways to display the data, interpret the represented data, and communicate their findings.
- Resource details
- Year level
- Year 5
- Purpose
- Planning Teaching resource Teaching strategies Student activities
- Strand
- Statistics
- Topic
- Statistical investigations
- Audience
- Teachers
- Format
- Webpage
- Numeracy progression
- Interpreting and representing data (P4)
- Publisher
- Commonwealth of Australia
- Copyright
- © 2023 Commonwealth of Australia, unless otherwise indicated. Creative Commons Attribution 4.0, unless otherwise indicated
- Other terms
- lesson plans assessment task teaching strategies pedagogies Australian Curriculum learning from home misconceptions
Related resources
-
Indigenous Ecological Knowledge and celestial objects
Students investigate how Aboriginal and Torres Strait Islander Peoples use the stars and moon to understand seasonal changes, and plant and animal behaviours, strengthening connections to Country.
Resource details -
Stellar navigation and mathematics
Students will learn about celestial positions, the azimuth and altitude to shape their understanding of traditional navigational techniques.
Resource details -
Statistics: Time to play
Statistics: Time to play
Resource details -
Paying It Forward
Paying It Forward is a free teaching resource written by Australian primary school teachers for teachers.
Resource details -
Time and statistics (5 lessons)
In this sequence of 5 lessons, students learn to read and convert 12- and 24-hour time, interpret line graphs, and analyse data by planning and conducting a statistical investigation.
Resource details -
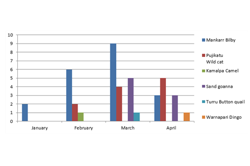
Where’s the mankarr? Recording and visualising data: Part 2
In this second of two lessons, students view a video to record data about the bilby (mankarr). They visualise and interpret the data.
Resource details -

Flight of the osprey infographic
In this lesson, students use data acquired during their learning about the osprey and information sourced online to design and create an infographic.
Resource details