
Reconciliation progress
Students explore the notion of reconciliation in Australia by analysing a report – Reconciliation Australia’s Australian Reconciliation Barometer – to answer an inquiry question for their statistical investigation.
This lesson was developed in collaboration with Caty Morris and Aboriginal and Torres Strait Islander Mathematics Alliance (ATSIMA).
- Resource details
- Year level
- Year 9
- Purpose
- Teaching resource
- Strand
- Statistics
- Topic
- Statistical investigations
- Audience
- Teachers
- Format
- Webpage
- Australian Curriculum code
- AC9M9ST05
- Cross-curriculum priorities
- Aboriginal and Torres Strait Islander Histories and Cultures
- Numeracy progression
- Interpreting and representing data (P8)
- Publisher
- Commonwealth of Australia
- Copyright
- © 2024 Commonwealth of Australia. Creative Commons BY 4.0.
- Other terms
- Maths Hub lesson plan spreadsheet stacked bar chart side-by-side graph First Nations Australian
Related resources
-
Mathematics of bushfire
Mathematics and traditional knowledge help us understand and manage bushfires, protecting people, communities, and the environment.
Resource details -
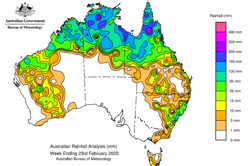
Conduct statistical investigations: Year 9 – planning tool
This planning resource for Year 9 is for the topic of Conduct statistical investigations.
Resource details -
Educational Datasets
These teacher guides describe the datasets for teachers and provide a range of lesson activities for students in Years 3 to 10. Datasets are grouped according to where the data's context fits into learning areas of the Australian Curriculum.
Resource details -
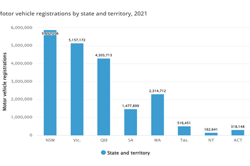
The cost of cars
Students learn about car ownership in Australia and the real cost of buying and running a car.
Resource details -
Probability and statistics in game design (4 lessons)
In this sequence of 4 lessons, students analyse data, bias, and probability using games to explore fairness, strategies, and the difference between experimental and theoretical results.
Resource details -
Data and statistics (7 lessons)
In this sequence of 10 lessons, students analyse and compare numerical data using histograms, stem-and-leaf plots, measures of centre and sampling methods.
Resource details -
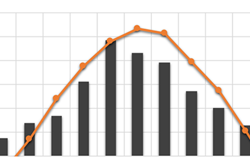
Perfect pricing
In this lesson, students are hotel managers conducting a statistical investigation to help them decide on a model for the perfect pricing structure for a new hotel/holiday resort.
Resource details