Year level: 6
Strand: Statistics
Lesson length: 80-100 mins
This lesson involves students creating an infographic to promote their findings from their statistical investigation in the previous lesson ‘Does using less water make a difference?’. The key elements of making an informed argument are also discussed.
This lesson is the fifth of 5 lessons (opens in a new window) that connect the cross-curriculum priority of Sustainability with Number, Measurement and Statistics. It can also serve as an introduction to AC9M6ST02 (opens external website in a new window) .

Learning goals
Learning intention
- We are learning to present our findings from our statistical investigation using an infographic.
- We are learning about the key elements of making an informed argument.
(Also available on slide 2 of the teacher’s slides)
Success criteria
By the end of this lesson, students can:
- present their findings from a statistical investigation using an infographic
- name at least 3 key elements of making an informed argument.
Why are we learning about this?
Making informed arguments is about presenting your ideas accurately with evidence to support what you’re saying, so that your audience has confidence in your conclusions.
Understanding the key elements of making informed arguments also helps with analysing others' ideas and claims.
(Also available on slide 3 of the teacher’s slides)
Learning hook 5 mins
- Download and use the teacher’s slides to accompany your teaching. You will find this in the ‘What you need’ section.
- This activity is about data representation and storytelling.
Display slide 4 and ensure that students realise both graphs are displaying the same data.
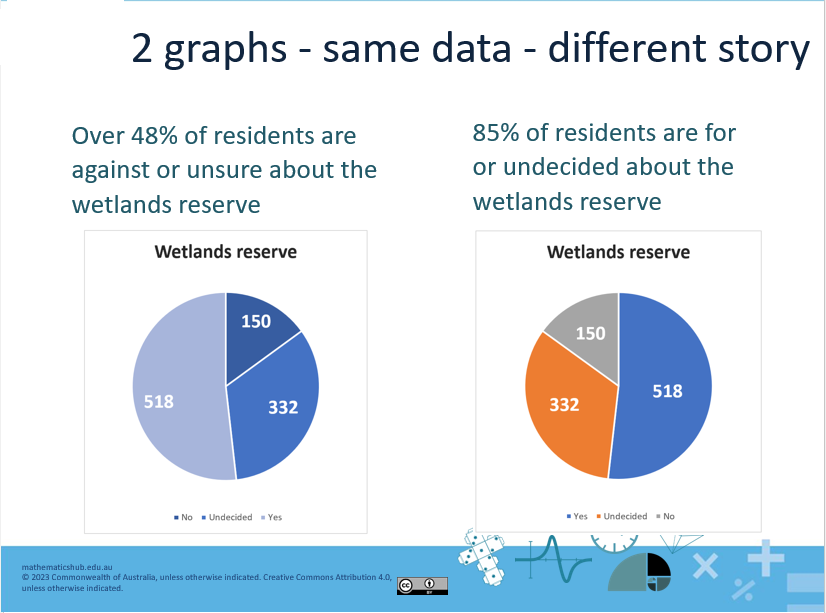
Slide 4
Ask students to consider both the headings and corresponding graphs.
- What story do you think each graph is looking to tell?
- Might the headings change how people feel about the wetlands reserve? Why?
- What do you notice about the use of colour in each graph? Do you think it’s deliberate – explain?
Slide 5 shows the data the graphs are based on in a table, alongside the graphs, this can be helpful when drawing the discussion together.
Explore 60 mins
Introduction (10 – 20 mins)
- Introduce the lesson focus, which is for students to create an infographic to promote their findings from their statistical investigation in the previous lesson.
- Display slide 6 and use the given statement (which has been invented) as a stimulus to explore key elements of making an informed argument, before students start planning their infographic.
Claim: An Australia wide survey reveals that for 92% of Year 6 students, the more time they spend doing homework the happier they become!Ask students if they find anything surprising about the statement, anything they might want to know more about.
Lead the discussion towards the importance of understanding some details about the research undertaken and any assumptions made, for example:
- How many people were surveyed? 10, 20, 100, 1000 …
- How were the people selected? Did they ask friends, family, all from one school/State, …
- Were the students happier because they were closer to having their homework completed, or because they like doing homework?
- Does the research method and findings support the claim being made?
- Either explicitly teach, or together as a class, establish some important elements their infographic should include if they want people to have confidence in the information presented.
- Clearly state the inquiry question you researched
- Outline your research approach and any assumptions made
- Present findings in a way that is easy to understand and follow
- Make sure your evidence (findings) back up your claims
- Consider showing students some sample infographics before they start planning and creating their own. (See web pages listed under the Resources section).
- Display slide 7 and check to see if students have any additional clarifying questions before starting the activity.
- Keep slide 7 visible for students to refer to.
Have resources available for students to either create their infographic digitally or by-hand.
Observe how students are approaching the task, support them with language and enabling and extending prompts as required. - Some students may still want to know the average cost of a kilolitre of water to a home in an Australian city (around $3.43 per kilolitre).
Differentiation (opens in a new window) (support)
- What did you discover when investigating your inquiry question?
- How much water does this change save? How did you work that out?
- How could you help other people understand these findings? What might be a simple way to display this data?
Differentiation (extend)
Can you think of a way to present the water saving information so that people might be more likely to change their actions? For example, come up with a catchy jingle?
Summary and reflection 15 mins
Pair students up and have them review each other’s infographic (slide 8).
Reflections can be shared using phrases such as:
- I wonder ...
- I really like the way you have …
- What if ...
- I am not sure about ...
If time permits, repeat with a different student pair.
- Consider making all infographics available for display.