
Please note: This site contains links to websites not controlled by the Australian Government or ESA. Read more in the Terms of Use.
Mathematical modelling: What makes us happy? for Year 10.
Students analyse wealth and happiness using real data, creating scatterplots, lines of best fit and r², and evaluating limits of correlation.
- Resource details
- Year level
- Year 10
- Purpose
- Teaching resource
- Strand
- Statistics
- Topic
- Mathematical modelling Statistical investigations
- Audience
- Teachers
- Format
- Webpage
- Australian Curriculum code
- AC9M10ST03 AC9M10ST04 AC9M10ST05
- Numeracy progression
- Interpreting and representing data (P8)
- Publisher
Australian Academy of Science
- Copyright
© 2026 Australian Academy of Science. Creative Commons BY-NC-SA 4.0.
Related resources
-
Geometry of water sources and landforms
Develop an understanding of Aboriginal and Torres Strait Islander Peoples’ deep connection to water, and explore how mathematics supports survival, culture, and caring for Country.
Resource details -

Mathematical modelling (Algebra): Year 10 – planning tool
This planning resource for Year 10 is for the topic of Mathematical modelling.
Resource details -
Mathematical modelling (Measurement): Year 10 – planning tool
This planning resource for Year 10 is for the topic of Mathematical modelling.
Resource details -
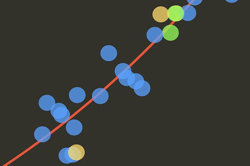
Conduct statistical investigations: Year 10 – planning tool
This planning resource for Year 10 is for the topic of Conduct statistical investigations.
Resource details -
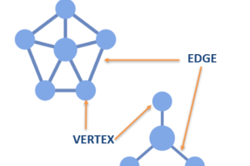
Capital Airways: Part 2
This is the second lesson in the Capital Airways series and follows the prior lesson Capital Airways: Part 1. Students investigate a network through an airline route map.
Resource details -
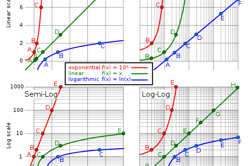
Off the scale
This lesson introduces students to the idea of a log scale, a seemingly perplexing way to present data. The lesson begins with an exploration of examples when a linear scale is inappropriate and concludes with a plotting activity using authentic data from the COVID-19 pandemic.
Resource details -
Educational Datasets
These teacher guides describe the datasets for teachers and provide a range of lesson activities for students in Years 3 to 10. Datasets are grouped according to where the data's context fits into learning areas of the Australian Curriculum.
Resource details