Please note: This site contains links to websites not controlled by the Australian Government or ESA. More information here.
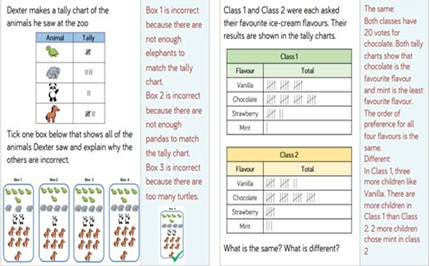
Statistics: tally charts, pictograms and block diagrams
This guide provides a sequence of steps to develop understanding of data displays, from using tally charts through to drawing and interpreting pictograms involving multiplicative thinking.
Additional details |
|
| Year level(s) | Year 1, Year 2, Year 3 |
|---|---|
| Audience | Teacher |
| Purpose | Teaching resource, Teaching strategies |
| Format | Downloadable resources |
| Teaching strategies and pedagogical approaches | Questioning, Explicit teaching |
| Keywords | data, tally, tally charts, pictogram, block diagram, interpret, reasoning, explicit teaching |
Curriculum alignment |
|
| Curriculum connections | Numeracy |
| Strand and focus | Number, Statistics, Build understanding |
| Topics | Addition and subtraction, Multiplication and division, Data representation and interpretation |
| AC: Mathematics (V9.0) content descriptions |
AC9M1ST02
Represent collected data for a categorical variable using one-to-one displays and digital tools where appropriate; compare the data using frequencies and discuss the findings
AC9M2ST01
Acquire data for categorical variables through surveys, observation, experiment and using digital tools; sort data into relevant categories and display data using lists and tables
AC9M2ST02
Create different graphical representations of data using software where appropriate; compare the different representations, identify and describe common and distinctive features in response to questions
AC9M3ST02
Create and compare different graphical representations of data sets including using software where appropriate; interpret the data in terms of the context |
| Numeracy progression |
Counting processes (P3)
Interpreting and representing data (P2, P3, P4) |
Copyright details |
|
| Organisation | White Rose Maths |
| Copyright | © 2021 White Rose Maths. Free-for-education material. |
Related resources
-

Rows of oranges
A Three-Act task on additive to multiplicative thinking.
Resource details -
Find my pattern
A guide to consolidating important number concepts and developing spatial reasoning.
Resource details -
Primary mastery professional development: Number
A guide to teaching about number
Resource details -
Number: Foundation to Year 9
A guide to teaching about number
Resource details